Note
Go to the end to download the full example code.
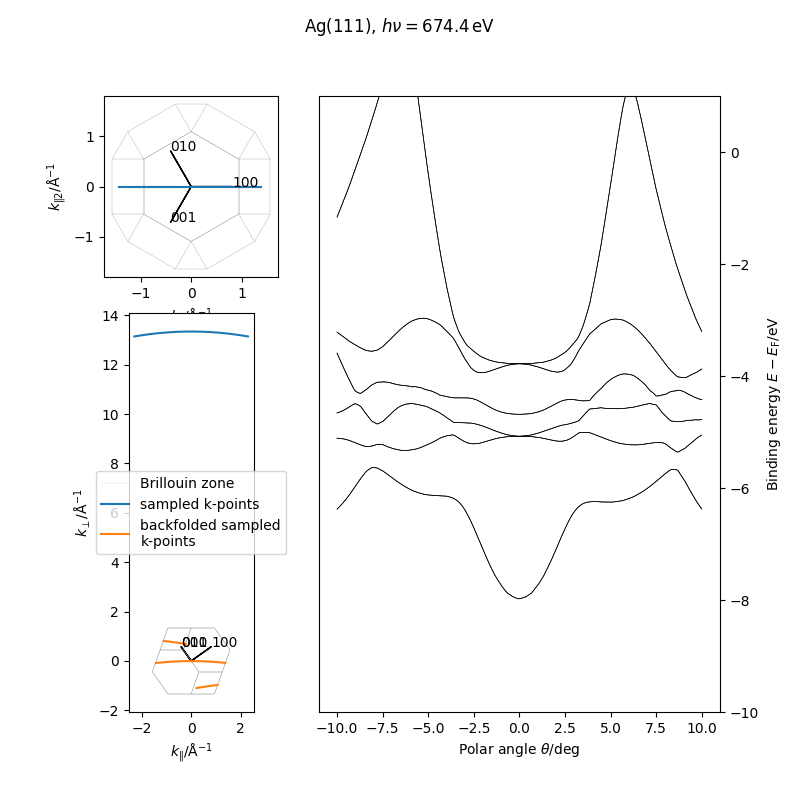
ARPES k-space cut
Got interpolator. Doing interpolation...
import numpy as np
from fplore import FPLORun
from fplore.arpes import k_arpes
from fplore.util import rot_v1_v2, sample_e
from fplore.plot import plot_bz_proj
import matplotlib.pyplot as plt
import matplotlib.gridspec as gridspec

run = FPLORun("../example_data/Ag")

surface_normal = [1, 1, 1]  # todo conventional to primitive

thetacenter = 0
thetawidth = 20
theta = np.linspace(np.deg2rad(thetacenter-thetawidth/2), np.deg2rad(thetacenter+thetawidth/2), 200)
theta2 = np.array([np.deg2rad(0)])
v0 = 8
workfunc_analyzer = 3.8
e_photon = 674.4

R = rot_v1_v2(surface_normal, [0, 0, 1])
phi = np.deg2rad(15)
c, s = np.cos(phi), np.sin(phi)
R = np.dot(np.array(((c, -s, 0), (s, c, 0), (0, 0, 1))), R)

# todo: order of rotation operations
# todo: setup_arpes_geometry(photon momentum, angles, ...)

plt.figure(figsize=(8, 8))
gs = gridspec.GridSpec(3, 3)
ax1 = plt.subplot(gs[0, 0])
ax2 = plt.subplot(gs[1:, 0])
ax3 = plt.subplot(gs[:, 1:])

plot_bz_proj(run, ax1, rot=R.T, axis=2, color='grey', lw=0.1)
ax1.set_xlabel(r'$k_\| / \mathrm{\AA}^{-1}$',)
ax1.set_ylabel(r'$k_{\|2} / \mathrm{\AA}^{-1}$')


plot_bz_proj(run, ax2, rot=R.T, axis=1, color='grey', lw=0.1, neighbours=[])


k_p = k_arpes(theta=theta, e_photon=e_photon, phi_det=workfunc_analyzer, v0=v0, theta2=theta2)

ax2.plot(k_p[:, 0], k_p[:, 2], label='sampled k-points')


k = k_p @ R  # aligned -> calculation

k_1bz = run.backfold_k(k)
k_1bz_aligned = k_1bz @ R.T  # calculation -> aligned

dists = np.linalg.norm(np.diff(k_1bz, axis=0), axis=1)
dists_ = np.linalg.norm(np.diff(k, axis=0), axis=1)
# insert nans to make BZ folds discontinuous
k_1bz_2d = np.insert(k_1bz_aligned, np.where(dists > 1.01*dists_)[0]+1,
                     np.array([[np.nan, np.nan, np.nan]]), axis=0)
ax1.plot(*k_1bz_2d[:, [True, True, False]].T)
ax2.plot(*k_1bz_2d[:, [True, False, True]].T, label='backfolded sampled\nk-points')

ax2.set_xlabel(r'$k_\| / \mathrm{\AA}^{-1}$',)
ax2.set_ylabel(r'$k_\perp / \mathrm{\AA}^{-1}$')
ax2.legend(loc='center')

energy_window = (-10., 1.)
level_indices = run.band.bands_within(*energy_window)
ip = run.band.get_interpolator(bands=level_indices)
print('Got interpolator. Doing interpolation...')
data = ip(k_1bz)

path = k_1bz
ax3.plot(np.rad2deg(theta), data, color='k', lw=0.5)
ax3.set_ylabel(r'Binding energy $E-E_\mathrm{F}/\mathrm{eV}$')
ax3.set_xlabel(r'Polar angle $\theta/\mathrm{deg}$')
ax3.set_ylim(*energy_window)
ax3.yaxis.tick_right()
ax3.yaxis.set_label_position("right")

plt.suptitle(r'Ag(111), $h\nu = {}\,\mathrm{{eV}}$'.format(e_photon))
plt.show()
Total running time of the script: (3 minutes 4.983 seconds)