Note
Go to the end to download the full example code.
Standard band plot
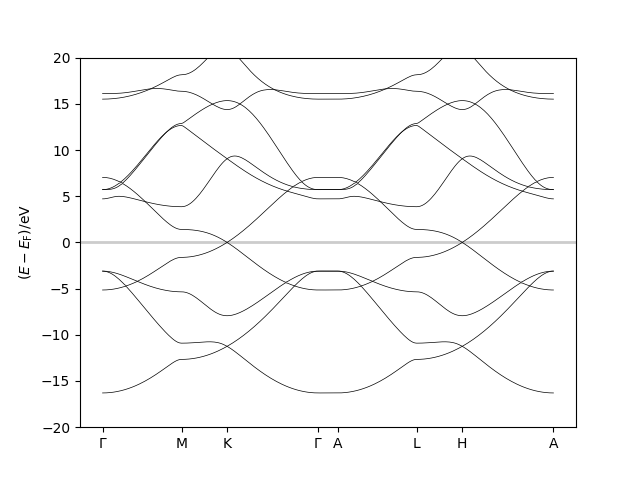
from fplore import FPLORun
import matplotlib.pyplot as plt

run = FPLORun("../example_data/graphene_slab")

fig = plt.figure()

points = run["+points"].data
iks, labels = zip(*points)
labels = [label.replace('$~G', r'$\Gamma$') for label in labels]

band_data = run["+band"].data

plt.axhline(0, alpha=0.2, color='k', lw=2)
plt.plot(band_data['ik'], band_data['e'], color='k', lw=0.5)
plt.xticks(iks, labels)
plt.ylabel(r"$(E - E_\mathrm{F})/\mathrm{eV}$")
plt.ylim([-20, 20])

plt.show()
Total running time of the script: (0 minutes 0.317 seconds)