Note
Go to the end to download the full example code.
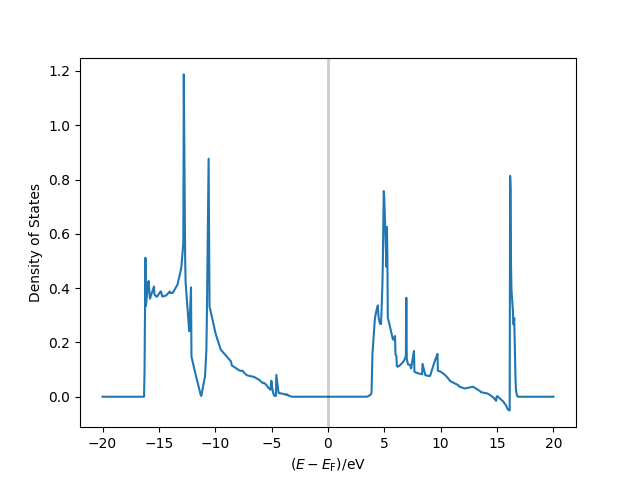
Density of states
from fplore import FPLORun
import matplotlib.pyplot as plt

run = FPLORun("../example_data/graphene_slab")

dos_data = run["+dos.total.l001"].data[0]
plt.plot(dos_data["e"], dos_data["dos"])

plt.axvline(0, alpha=0.2, color='k', lw=2)
plt.xlabel(r"$(E - E_\mathrm{F})/\mathrm{eV}$")
plt.ylabel(r"Density of States")

plt.show()
Total running time of the script: (0 minutes 0.292 seconds)